


 62 / 120

59
Annual Report 2015
-59-
(C)
Level 3
Level 3 inputs are inputs for assets or liabilities that are unobservable in the market (unobservable inputs, e.g. option pricing model
using history volatility rate, because history volatility rate cannot represent the expectation value of market participants for future
volatility rate).
B.
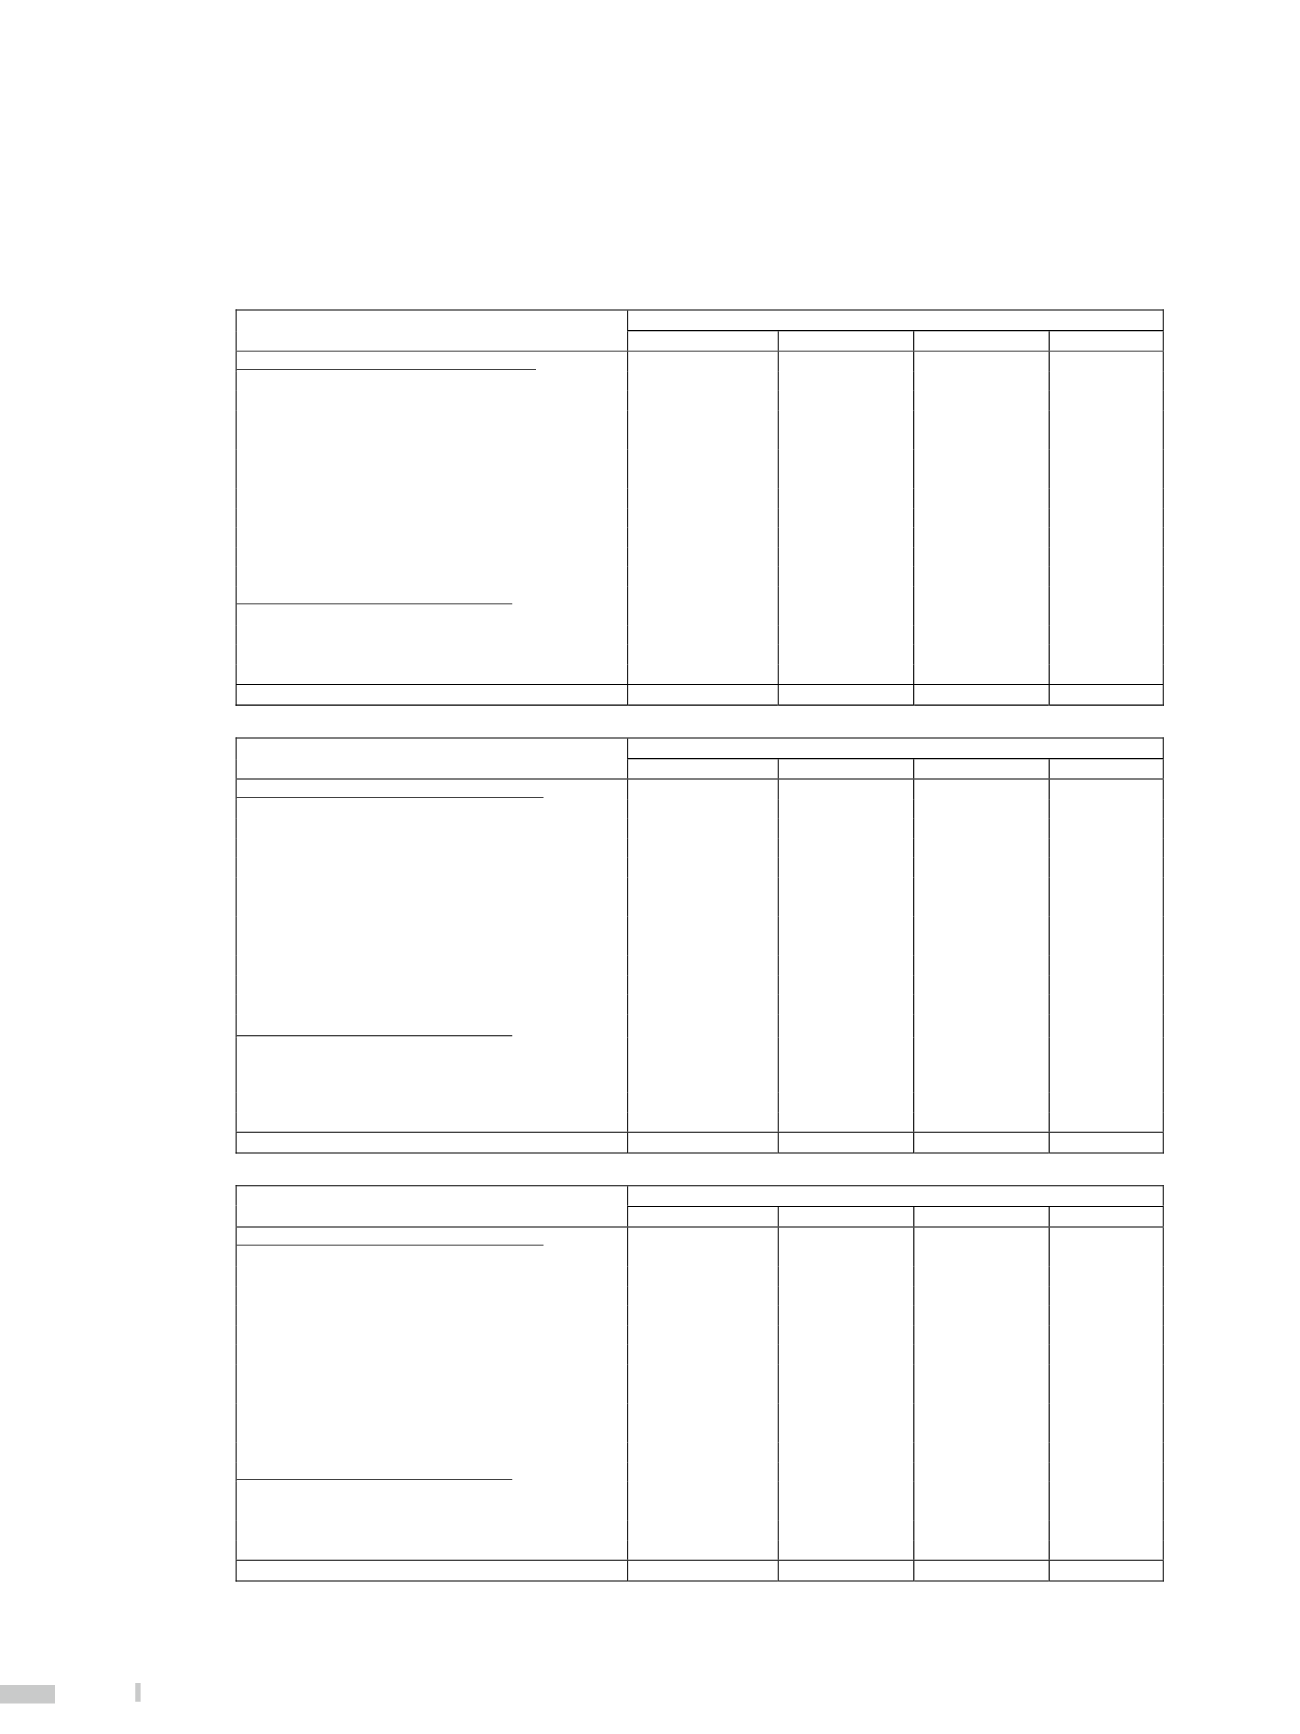
Information of fair value hierarchy of financial instruments
(In NT Thousand Dollars)
Recurring fair value measurements
December 31, 2015
Total
Level 1
Level 2
Level 3
Non-derivative financial assets and libilities
Assets
Financial assets at fair value through profit or loss
Investment in stock
$
2,791,248 $
2,791,248 $
- $
-
Investment in bonds
39,379,542
2,170,654
37,208,888
-
Available-for-sale financial assets
Investment in stock
8,109,063
6,342,833
1,766,230
-
Investment in bonds
134,751,677
28,391,032
106,360,645
-
Commercial paper and certificate of deposit
88,518,247
-
88,518,247
Other
128,107
18,082
110,025
-
Liabilities
Financial liabilities at fair value through profit or loss (
17,181,429 )
- (
17,181,429 )
-
Derivative financial assets and liabilities
Assets
Financial assets at fair value through profit or loss
4,857,594
-
4,857,594
-
Liabilities
Financial liabilities at fair value through profit or loss (
4,757,866 )
- (
4,757,866 )
-
Total
$
256,596,183 $
39,713,849 $ 216,882,334 $
-
(In US Thousand Dollars)
Recurring fair value measurements
December 31, 2015
Total
Level 1
Level 2
Level 3
Non-derivative financial assets and liabilities
Assets
Financial assets at fair value through profit or loss
Investment in stock
$
84,871 $
84,871 $
- $
-
Investment in bonds
1,197,384
66,002
1,131,382
-
Available-for-sale financial assets
Investment in stock
246,566
192,862
53,704
-
Investment in bonds
4,097,290
863,264
3,234,026
-
Commercial paper and certificate of deposit
2,691,506
-
2,691,506
Other
3,895
550
3,345
-
Liabilities
Financial liabilities at fair value through profit or loss (
522,422 )
- (
522,422 )
-
Derivative financial assets and liabilities
Assets
Financial assets at fair value through profit or loss
147,701
-
147,701
-
Liabilities
Financial liabilities at fair value through profit or loss (
144,669 )
- (
144,669 )
-
Total
$
7,802,122 $
1,207,549 $
6,594,573 $
-
(In NT Thousand Dollars)
Recurring fair value measurements
December 31, 2014
Total
Level 1
Level 2
Level 3
Non-derivative financial assets and liabilities
Assets
Financial assets at fair value through profit or loss
Investment in stock
$
4 ,626,120 $
4,626,120 $
- $
-
Investment in bonds
34,004,666
2,822,848
31,181,818
-
Available-for-sale financial assets
Investment in stock
10,767,650
9,385,074
1,382,576
-
Investment in bonds
100,628,077
19,332,991
81,295,086
-
Commercial paper and certificate of deposit
75,615,846
-
75,615,846
-
Other
333,703
-
333,703
-
Liabilities
Financial liabilities at fair value through profit or loss (
19,919,886 )
- (
19,919,886 )
-
Derivative financial assets and liabilities
Assets
Financial assets at fair value through profit or loss
5,066,261
-
4,851,980
214,281
Liabilities
Financial liabilities at fair value through profit or loss (
7,425,472 )
- (
7,211,191 ) (
214,281)
Total
$
203,696,965 $
36,167,033 $ 167,529,932 $
-