


 22 / 120

19
Annual Report 2015
-19-
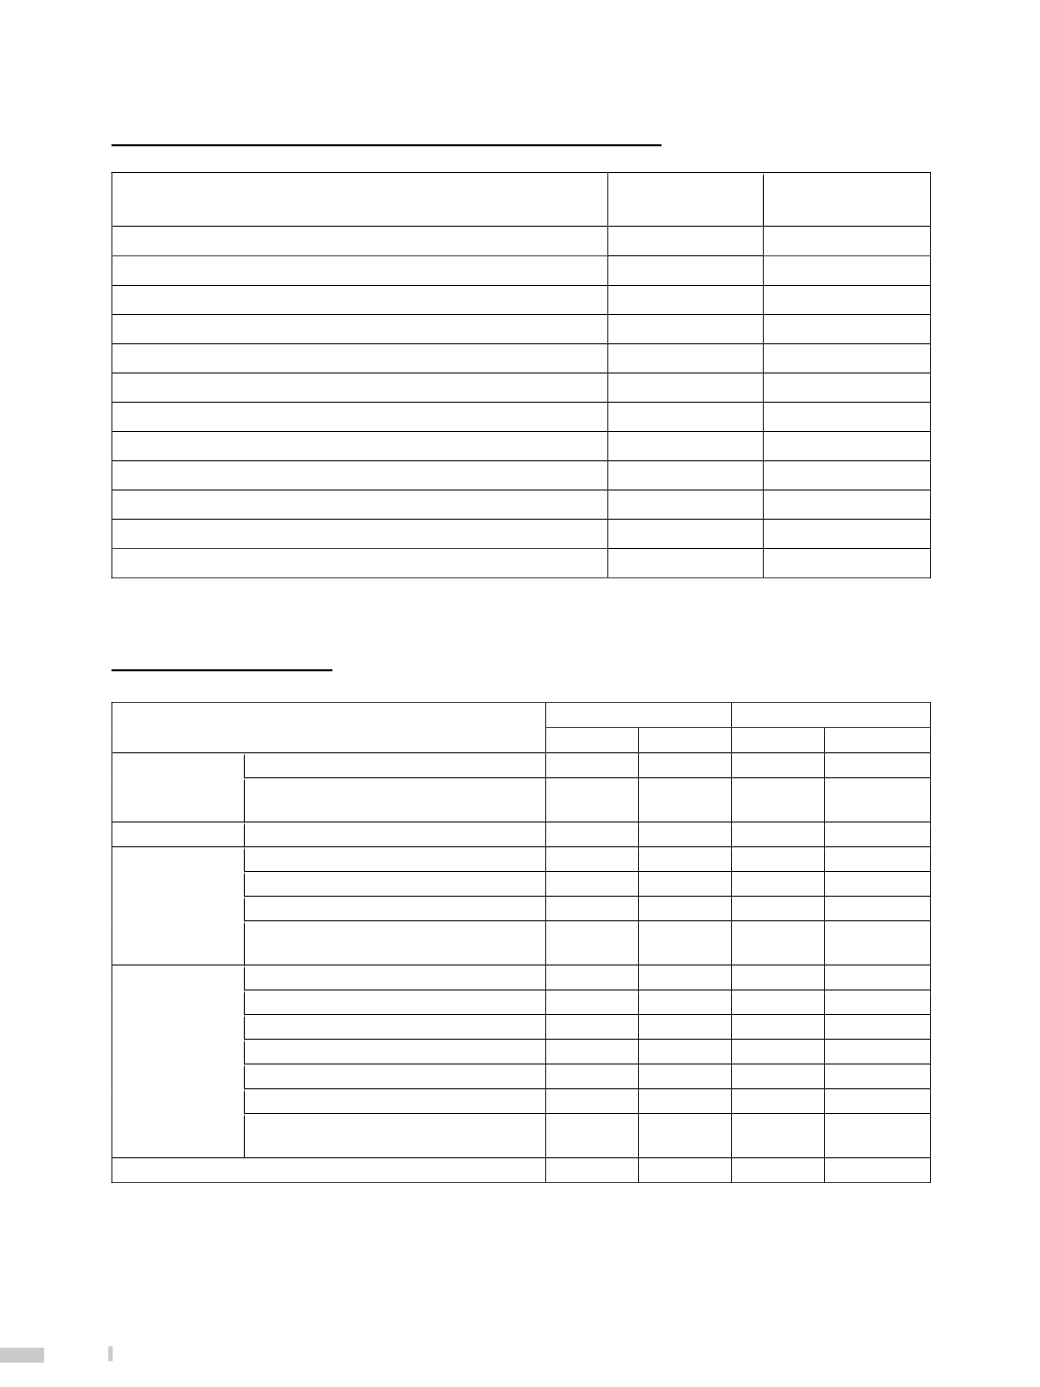
Condensed Consolidated Statements of Comprehensive Income
Unit: Thousands in NT dollars
Item
2015
2014
Interest Revenue
53,879,273
53,449,800
Less: Interest Expense
17,833,323
18,153,235
Net Interest Income
36,045,950
35,296,565
Net Non-Interest Income
14,195,272
15,869,712
Net Operating Income
50,241,222
51,166,277
Provision for Loan Losses and Guarantee Reversal (Reserve)
( 543,892 )
2,249,430
Operating Expenses
20,464,905
18,651,123
Consolidated Income from Continuing Operations Before Income Tax
30,320,209
30,265,724
Income Tax Expense
4,611,764
4,275,042
Consolidated Net Income
25,708,445
25,990,682
Total Other Comprehensive Income (After Income Tax)
( 3,721,805 )
3,110,813
Total Comprehensive Income
21,986,640
29,101,495
Major Financial Analysis
Item
Consolidated
Standalone
2015
2014
2015
2014
Financial
Structure
Total Liabilities to Total Assets (%)
91.69
92.54
91.64
92.50
Property and Equipment to Total
Shareholders' Equity (%)
5.63
6.63
5.61
6.61
Solvency
Liquidity Reserve Ratio (%)
22.66
21.53
22.66
21.53
Operating
Performance
Analysis
Loans to Deposits Ratio (%)
80.71
86.34
80.42
85.91
NPL Ratio (%)
0.09
0.07
0.08
0.06
Total Assets Turnover (Number of Times)
0.02
0.02
0.02
0.02
Average Profit per Employee (Thousands
in NT dollars)
4,553
4,638
4,693
4,783
Profitability
Analysis
Return on Tier 1 Capital (%)
13.41
15.18
13.56
15.38
ROA (%)
0.85
0.90
0.85
0.90
ROE (%)
10.89
12.40
10.89
12.40
Net Income to Net Operating Income (%)
51.17
50.80
51.61
51.28
Earnings per Share (NT dollars)
3.27
3.37
3.27
3.37
Cash Dividends per Share (NT dollars)
1.50
1.44
1.50
1.44
Shareholders' Equity per Share Before
Appropriation (NT dollars)
29.70
28.38
29.70
28.38*
Capital Adequacy Ratio (%)
13.33
11.95
13.16
11.76
*: As of 2015, the Bank and its subsidiaries adopted 2013 version of IFRSs as endorsed by the FSC. Financial
information was retroactively adjusted to provide comparability.
!