


 80 / 120

77
Annual Report 2015
-77-
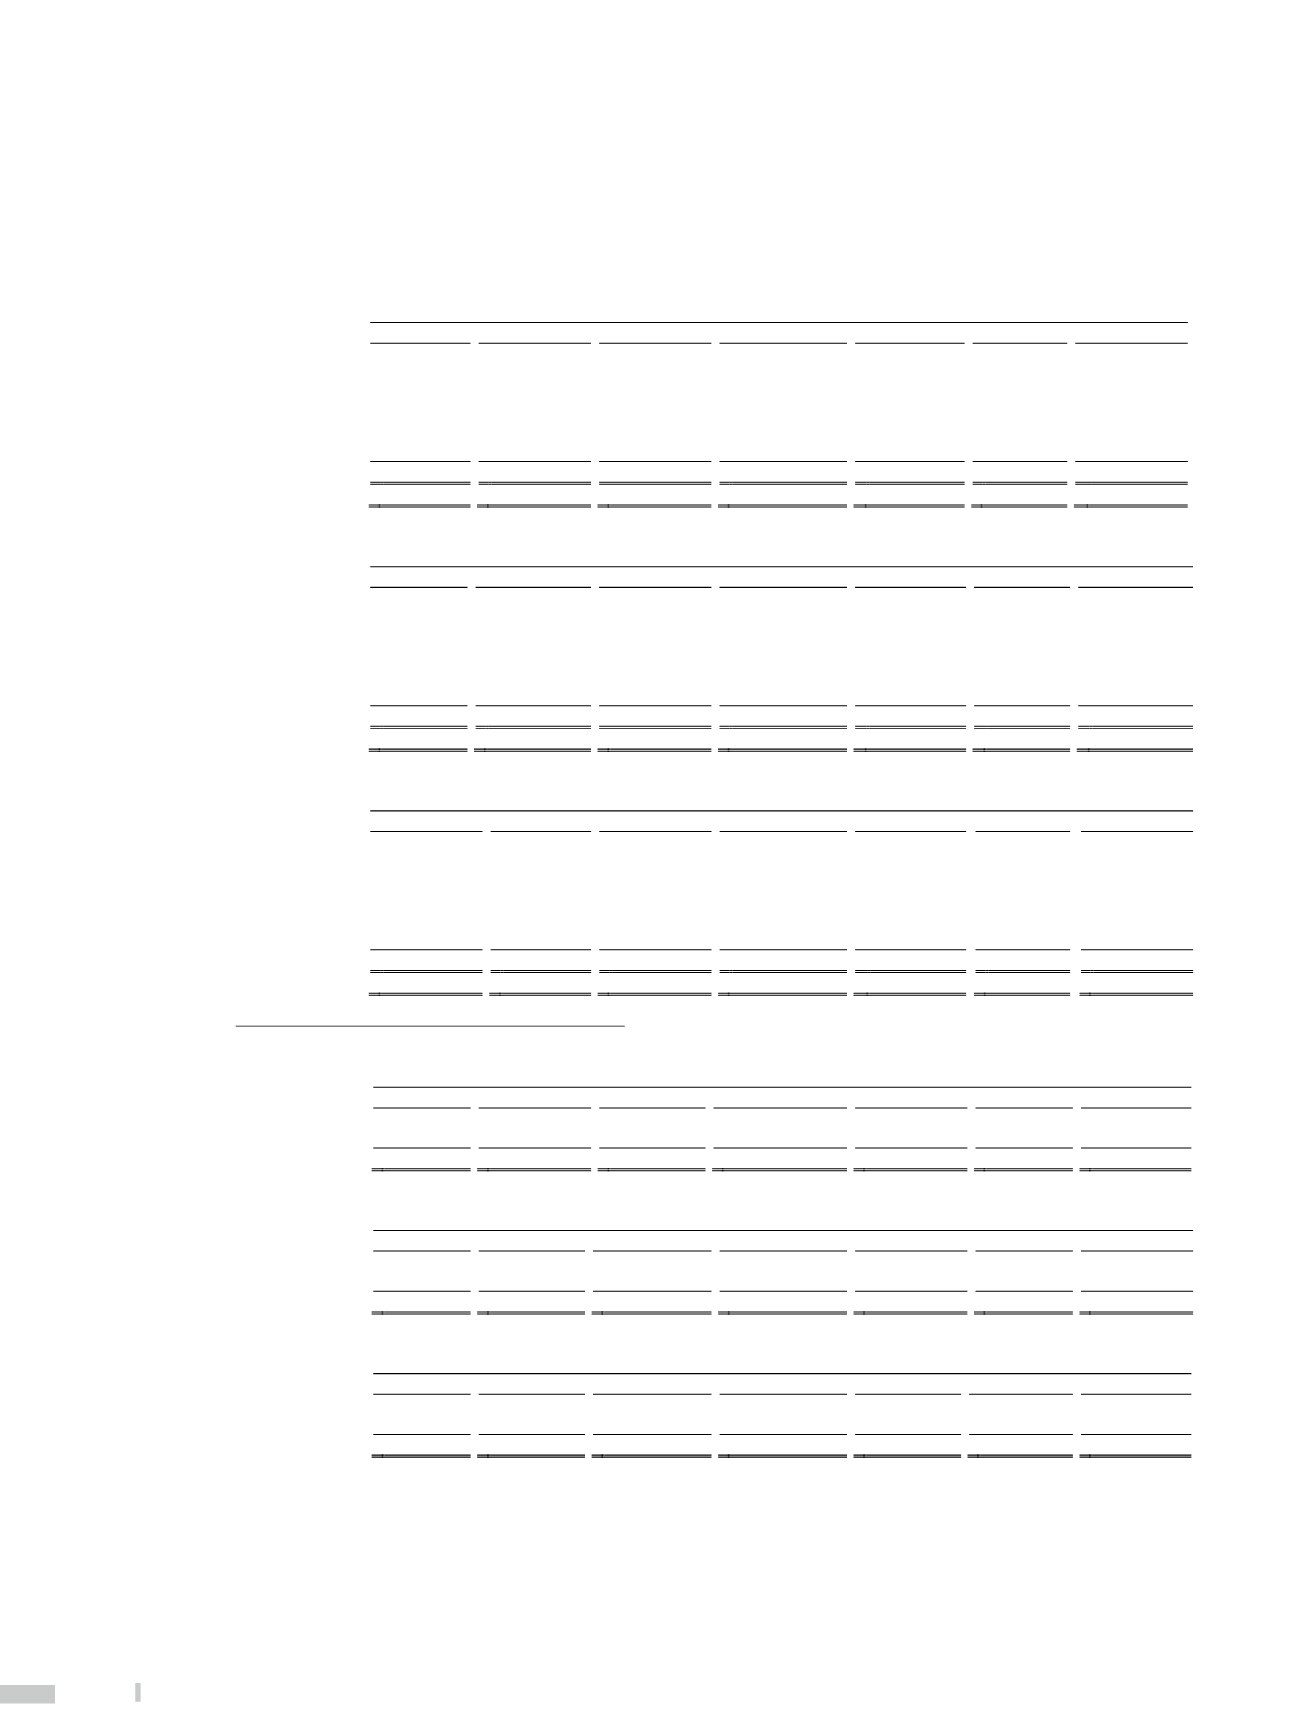
(B)
Derivatives settled on a gross basis
Derivatives of the Bank and its subsidiaries settled on a gross basis include:
a.
Foreign exchange derivatives: forward exchange
b.
Interest derivatives: cross currency swaps and currency swaps
UNIT
:
In NT Thousand Dollars
December 31, 2015
1-30 days 31-90 days
91-180 days
181 days-1 year 1 year-5 years Over 5 years
Total
Foreign exchange derivative instruments
Inflow
$
36,982,855
$
18,200,017
$
6,624,541
$
6,855,960
$
207,784
$
-
$
68,871,157
Outflow
37,113,008
18,178,305
6,694,306
6,805,919
206,636
-
68,998,174
Interest rate derivative instruments
Inflow
287,052,683
154,550,737
98,456,581
25,737,148
238,315
3,390,391
569,425,855
Outflow
285,730,849
153,920,189
97,454,281
25,566,614
237,151
3,069,753
565,978,837
Total inflows
$
324,035,538
$
172,750,754
$
105,081,122
$
32,593,108
$
446,099
$
3,390,391
$
638,297,012
Total outflows
$
322,843,857
$
172,098,494
$
104,148,587
$
32,372,533
$
443,787
$
3,069,753
$
634,977,011
UNIT
:
In US Thousand Dollars
December 31, 2015
1-30 days 31-90 days
91-180 days
181 days-1 year 1 year-5 years Over 5 years
Total
Foreign exchange derivative instruments
Inflow
$ 1,124,509
$
553,394 $
201,428 $
208,463 $
6,318
$
- $ 2,094,112
Outflow
1,128,467
552,734
203,548
206,942
6,283
-
2,097,974
Interest rate derivative instruments
Inflow
8,728,189
4,699,305
2,993,693
782,570
7,246
103,089
17,314,092
Outflow
8,687,997
4,680,132
2,963,217
777,384
7,211
93,340
17,209,281
Total inflows
$ 9,852,698
$
5,252,699 $ 3,195,121 $
991,033 $
13,564
$
103,089 $ 19,408,204
Total outflows
$ 9,816,464
$
5,232,866 $ 3,166,765 $
984,326 $
13,494
$
93,340 $ 19,307,255
UNIT
:
In NT Thousand Dollars
December 31, 2014
1-30 days
31-90 days
91-180 days
181 days-1 year 1 year-5 years Over 5 years
Total
Foreign exchange derivative instruments
Inflow
$ 29,118,147
$ 15,364,459 $ 9,951,303 $
2,479,995 $ 1,356,880
$
- $ 58,270,784
Outflow
29,218,281
15,607,300
10,098,013
2,498,221
1,356,645
-
58,778,460
Interest rate derivative instruments
Inflow
343,667,061
71,589,619
49,354,178
46,622,413
13,841
1,372,474
512,619,586
Outflow
343,808,938
69,022,380
46,863,052
44,480,057
11,198
1,220,012
505,405,637
Total inflows
$ 372,785,208
$ 86,954,078 $ 59,305,481 $ 49,102,408 $ 1,370,721
$ 1,372,474 $ 570,890,370
Total outflows
$ 373,027,219
$ 84,629,680 $ 56,961,065 $ 46,978,278 $ 1,367,843
$ 1,220,012 $ 564,184,097
E.
Ananlysis for off-balance sheet contractual commitments
UNIT
:
In NT Thousand Dollars
December 31, 2015
1-30 days 31-90 days
91-180 days
181 days-1 year 1 year-5 years Over 5 years
Total
Irrevocable commitments
$
972,703 $
870,438 $ 59,846,527 $
2,695,566 $ 23,113,052 $ 78,610,712 $ 166,108,998
Financial guarantee contracts
51,556,895
54,250,919 42,740,400
98,310,823
24,631,458 1,357,667
272,848,162
Total
$ 52,529,598 $ 55,121,357 $ 102,586,927 $ 101,006,389 $ 47,744,510 $ 79,968,379 $ 438,957,160
UNIT
:
In US Thousand Dollars
December 31, 2015
1-30 days 31-90 days
91-180 days
181 days-1 year 1 year-5 years Over 5 years
Total
Irrevocable commitments
$
29,576 $
26,467 $ 1,819,707 $
81,962 $
702,781 $ 2,390,255 $ 5,050,748
Financial guarantee contracts
1,567,651
1,649,566
1,299,574
2,989,261
748,949
41,282
8,296,283
Total
$ 1,597,227 $
1,676,033 $ 3,119,281 $
3,071,223 $ 1,451,730 $ 2,431,537 $ 13,347,031
UNIT
:
In NT Thousand Dollars
December 31, 2014
1-30 days 31-90 days
91-180 days
181 days-1 year 1 year-5 years Over 5 years
Total
Irrevocable commitments
$ 1,711,941 $
7,172,058 $ 58,004,277 $
1,896,535 $ 24,013,417 $ 78,335,705 $ 171,133,933
Financial guarantee contracts
53,397,736
58,572,438
48,851,049
111,409,460 21,061,207
841,145
294,133,035
Total
$ 55,109,677 $ 65,744,496 $ 106,855,326 $ 113,305,995 $ 45,074,624 $ 79,176,850 $ 465,266,968
a.
Off-balance sheet items include irrevocable commitments, financial guarantee contracts and leasing contractual commitments
b.
Irrevocable commitments include irrevocable arranged financing limit and credit card line commitments
c.
Financial gurantee contracts refer to gurantees and letters of credit issued