


 63 / 192

63
公
司
治
理
報
告
63
!
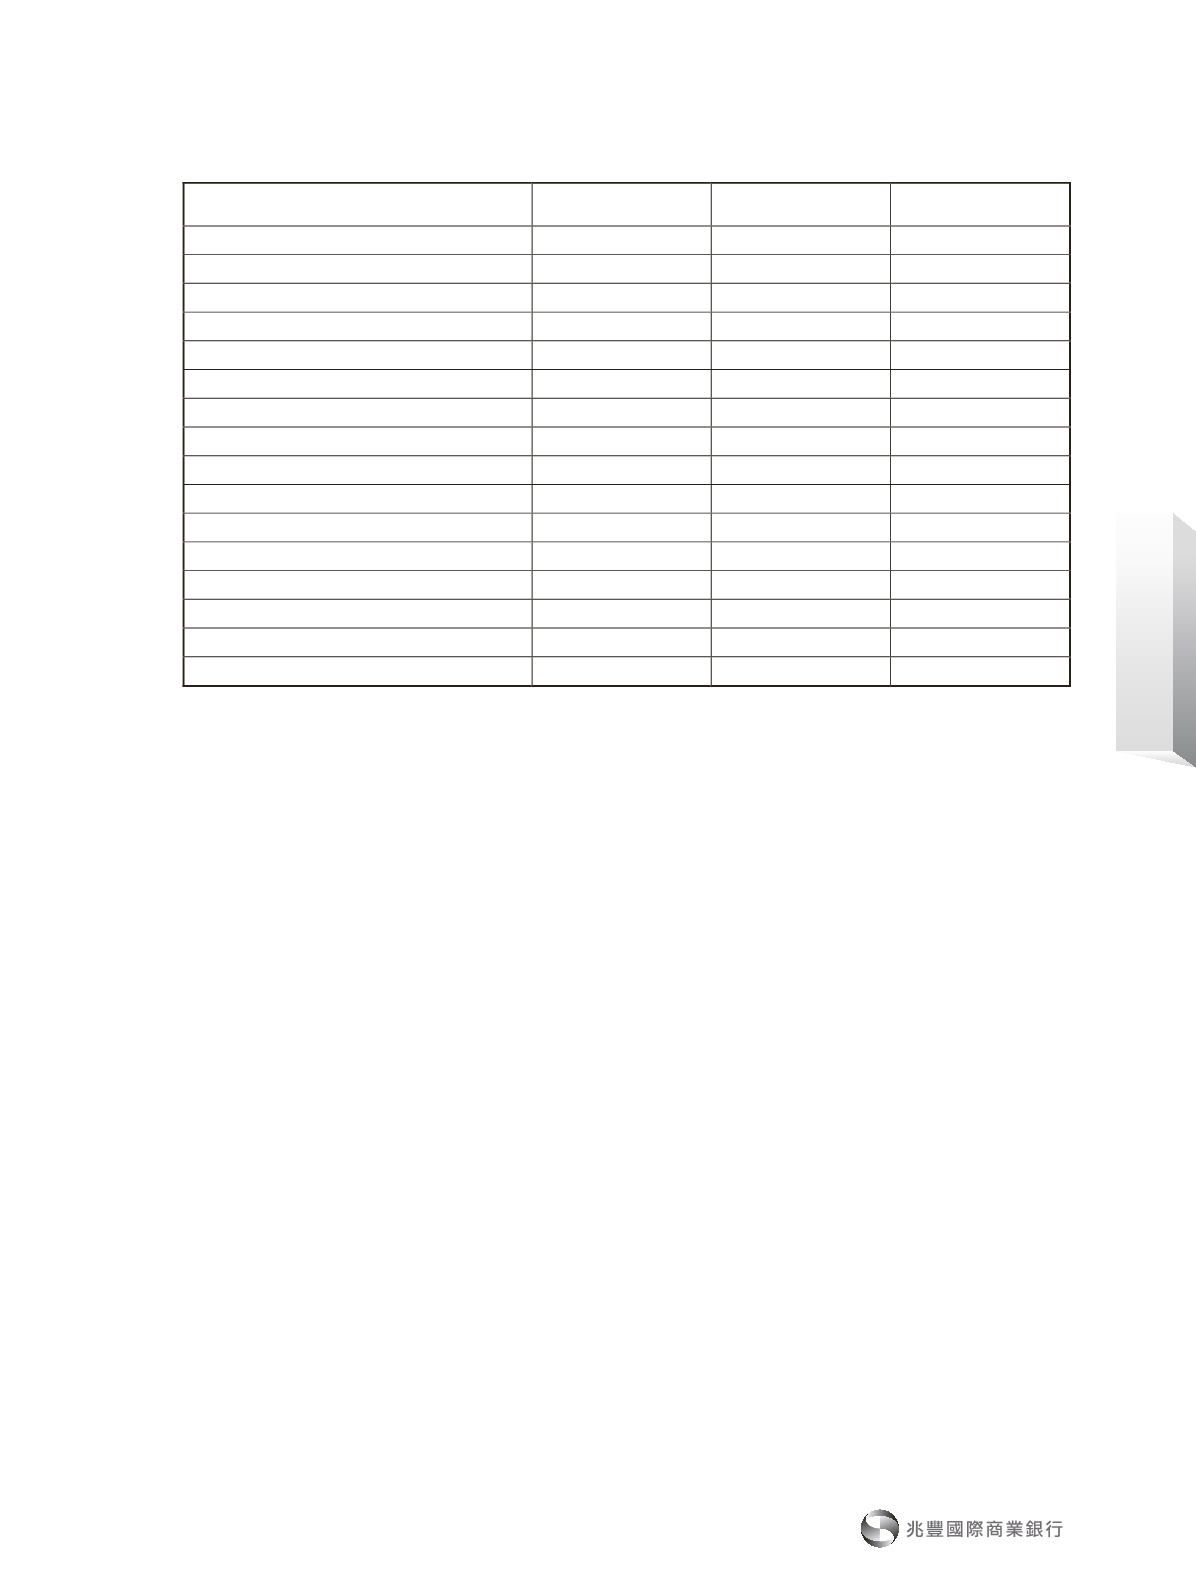
轉投資事業名稱
投資成本
持股數
持股比率(
%
)
艾德光能
(
開曼
)
控股
(
股
)
公司
113,773,500
3,000,000
1.30
Ramlett Finance Holdings Inc.
644,120
1,500
100.00
巴拿馬國泰倉庫公司
32,206,000
1,000
100.00
Healthcare Ventures VII, L.P.
86,732,701
0
1.41
Nanosys, Inc.
32,205,962
535,618
0.46
Pharos Science & Applications, Inc.
92,431
700,000
3.63
Healthcare Ventures VI, L.P.
141,334,699
0
1.65
Arch Venture Fund V, L.P.
123,588,523
0
1.43
Biotechnology Development Fund II, L.P.
8,086,476
0
9.17
Arch Venture Fund IV, L.P.
50,609,012
0
1.13
Biotechnology Development Fund, L.P.
13,293,788
0
3.57
Senseonics Holdings, Inc.
1,561,282
16,284
0.02
AbGenomics International Inc.
82,024,113
1,248,333
4.29
TVbean Holding Limited
17,994,000
1,599,600
5.70
兆豐國際商業銀行大眾
(
股
)
公司
3,594,400,000
400,000,000
100.00
加拿大兆豐國際商業銀行
549,672,000
230,000
100.00